MDIM Journal of Management Review and Practice

 Search
Sudhir Chandra Das1 and Shloka Singh1
1Faculty of Commerce, Banaras Hindu University, Varanasi, Uttar Pradesh, India

Creative Commons Non Commercial CC BY-NC: This article is distributed under the terms of the Creative Commons Attribution-NonCommercial 4.0 License (http://www.creativecommons.org/licenses/by-nc/4.0/) which permits non-Commercial use, reproduction and distribution of the work without further permission provided the original work is attributed.
The sole purpose of this article is to discover the information stored within the term ‘innovative work behaviour (IWB),’ with a specific focus on types of documents, contributions by nations/regions, journals, authors and keywords. The authors have used VOSviewer version 1.6.19 and R-Studios for conducting bibliometric analysis as an approach to represent the growth for this area during a specified period. The findings of the article reveal that IWB has developed into coherent research theme from past decades. Through analysis, various trends can be assessed, for example, the frequently used keywords (innovation, innovative work behavior), top nations/regions (U.S.A., Italy). The study concurs with some theoretical insights. Theoretically, bibliometric analysis decodes the collective information of the established field. IWB is used inter-changeably with ‘conception’, but it has a distinct character of its own which can be used for understanding and continuous development, this is necessary to ensure enhancement in the organization. Moreover, it provides an opportunity for researchers to dive in the present state of IWB. The study also aids in the lookout for future research direction. Present study has used bibliometric analysis to review time-based development (publications, keywords, institutions) in IWB for a period of more than 20 years, that is, 2001–2022. In conclusion, this bibliometric analysis offers an inclusive overview of the status of IWB research, which could assist an enhanced understanding of the development in this field in the past years.
Innovation, innovative work behavior, work engagement, psychological, empowerment, creativity, innovative work behavior
Introduction
The development of mankind has originated need for various aspects. These aspects vary from person to person. The heterogeneous needs enrooted the seed of creativity. ‘Change’ has been constant over the years. Knowledge is a sustainable resource for all beings (Deb, 2021; Del Giudice et al., 2017; El-Kassar et al., 2022) and as the wide user of knowledge, mankind frequently inclines to create something new. Innovative work behaviour (IWB) is critical to the advancement of workplaces, people, economies and in countries that must adapt to change and competition while also increasing the organization value (Ausat et al., 2022; Koednok & Sungsanit, 2018). Creativity is omnipresent, that is, it can occur anywhere necessitated. The pre-requisites for innovation are creative visions and notions (Rietzschel & Ritter, 2018). The branch that deals with the management of innovation at different workplaces is coined as innovation studies (Anderson & King, 1991). The company’s competitiveness has a significant influence on creativity. In case of business a consistent creativity can be witnessed over many years (Berg, 2016; Groza et al., 2016). Innovation is the finest strategy to survive in the shifting culture (Kleysen & Street, 2001). Organizational creativity is characterized as the source of innovation because the process of creativity maps the road for new ideas, commodities and solutions (Amabile et al., 1996; Amabile & Pratt, 2016; Perry-Smith, 2006; Valaei et al., 2017). The innovation-oriented literature talks about the significant input, that is, creativity, which ensures a long-run existence and upgradation of the entity (Botelho, 2020; Nguyen et al., 2023). Employee are an important asset to an organization and in order to enhance innovation in the operations/process/method, organization needs to rely on their employees (Chen et al., 2023; Ramamoorthy et al., 2005). The encouragement and support of every employee to discover and uncover strategies to reach goals and complete tasks is vital to the company’s development of innovation (Szczepa ska-Woszczyna & Dacko-Pikiewicz, 2014). In the words of various researchers, ‘A series of intentional constructing, outlining, and applying new ideas that boost work-role, group, or organisational performance is referred to as innovative work behaviour (IWB)’ (Bos-Nehles et al., 2017; De Jong & Den Hartog, 2010; Janssen, 2000; Mustafa et al., 2021; Purwanto, 2022; Scott & Bruce, 1994; Waheed et al., 2023). IWB surrounds itself with three distinct processes, that is, setting up a new notion, idea generation (Linsey et al., 2005; Yilmaz et al., 2016); obtaining external aid, idea promotion; creating a blueprint of idea, idea application (Radaelli et al., 2014). Hence, it can be concluded that an organization has a wholesome effect of IWB on its outcome (Baer et al., 2003; Janssen, 2001). Another important feature of IWB is its connection to learn at all levels, which can be characterized as successful applications with significant lessons (Høyrup, 2010).
In 1969, the term bibliometric was coined (Pritchard, 1969). Bibliometric or Scientometric is a quantitative analysis application constructed of mathematical and statistical tool of analysis. These have been widely used to identify research clusters and growth prospects in a certain area (Nederhof, 2006). Various disciplines have implemented bibliometric analysis to gain an insight in analysis of performance (Montero-Díaz et al., 2018). In other words, bibliometric can be put as a tool which shifts the analysis from a narrower (one publication, scientist or institute) to a broader (domestic or international) view with an add-on of excising the trend (Shi et al., 2020). The bibliometric analysis also works as a yardstick for measuring the academic influence (Heberger et al., 2010). Bibliometric can be considered as a map to find new trends, which will support scholars to design and plan the future study (Zhang, 2020).
Bibliometric has a wide range of applications. Many studies looked at elements, such as productive authors, influential journals, publishing data, affiliations and countries, when evaluating publication statistical characteristics (Chen et al., 2018). The paper reports on bibliometric analysis of IWB in research published from (2001–2022). The number of articles published, the evolution of terminology, citation methods, the most productive writers and journals in the topic of IWB are all taken into account. Current themes in the research and development of IWB, as well as the status and development trend of IWB, were analysed based on bibliometric analysis of contents. The study below produces various results, the prime conduct was overviewing the fields in which IWB was studied, if IWB occurs in more than one field than IWB can be declared interdisciplinary or multidisciplinary. The relevance of journals will be traced by journal analysis. The analysis of journals will also display the multiple themes in the field of IWB. The research productivity or publishing pattern of an author will be analysed using the analysis of authors (Culnan, 1986). To monitor the contribution of institutions, analysis of institutions will be conducted. Different clusters of IWB will be traced via keywords co-occurrence analysis, co-authorship analysis or co-citation analysis (Kraus et al., 2020). The rise of interest of scholars in bibliometric with the origination of different analysis tools like Gephi, Leximancer and VOSviewer (providing practical analysis) have attributed to the compilation and a smooth access of various database (Scopus and Web of Science) with an availability of large number of data. Indeed, the bibliometric methodology has been used in business research in a range of domains, including business strategy (Kumar et al., 2021a), electronic commerce (Kumar et al., 2021b), finance (Durisin & Puzone, 2009; Linnenluecke et al., 2017; Xu et al., 2018), human resources, management (Ellegaard & Wallin, 2015; Zupic &  ater, 2015) and marketing (Backhaus et al., 2011; Donthu et al., 2020; Hu et al., 2019; Samiee & Chabowski, 2012).
The most significant research gaps in the area of IWB have been completely addressed by the current study. Notably, previous scholarly attempts did not cover the most recent time frame, namely the year 2022, indicating a time gap in previous studies (Hassan et al., 2021; Peerzadah et al., 2023; Salam & Senin, 2022). The ‘Web of Science’ was mostly used as the database in earlier research in this field (Peng et al., 2021). Furthermore, it is remarkable that evaluations of bibliographic coupling based on institutional affiliations are still a novel area that has to be investigated in the aforementioned subject.
Objectives
The present study aims to enclose the following:
Methodology
The Database
As suggested in previous studies, there exists various database for bibliometric studies (Web of Science, Scopus, Dimensions) (Huang et al., 2023; Kumpulainen & Seppänen, 2022). In order to bridge the research gap, Scopus was used as the database in the present study as it contains publications from different disciplines, years, regions, institutions as it is the best database for peer-reviewed quotations and bibliography summaries (Jiménez-García et al., 2020). The data were accessed on 25 May 2023. The Scopus database is used for bibliometric analysis of various areas in social science discipline. There are more than 20,000 peer-reviewed journals, 370 book series and 5.5 million academic articles in the collection. The search for the related documents were done using the search key as ‘INNOVATIVE WORK BEHAVIOUR’.
A total of 8,382 appeared for the search out of which the data was restricted to the year 2001–2022. This limitation resulted to the count of 7,685 documents. The search string for the above is inserted below as,
TITLE-ABS-KEY(innovative work behaviour) AND ( LIMIT-TO (DOCTYPE, “ar”) OR LIMIT-TO (DOCTYPE, “cp”) OR LIMIT-TO ( DOCTYPE, “re”) OR LIMIT-TO (DOCTYPE, “ch”) OR LIMIT-TO ( DOCTYPE, “bk”) OR LIMIT-TO (DOCTYPE, “cr”) OR LIMIT-TO ( DOCTYPE, “ed”) OR LIMIT-TO (DOCTYPE, “no”) OR LIMIT-TO (DOCTYPE, “er”) OR LIMIT-TO (DOCTYPE, “sh”) OR LIMIT-TO (DOCTYPE, “dp”) OR LIMIT-TO (DOCTYPE, “le”) AND (EXCLUDE (PUBYEAR,2023) OR EXCLUDE (PUBYEAR,2000) OR EXCLUDE (PUBYEAR,1999) OR EXCLUDE (PUBYEAR,1998) OR EXCLUDE (PUBYEAR,1997) OR EXCLUDE (PUBYEAR,1996) OR EXCLUDE (PUBYEAR,1995) OR EXCLUDE (PUBYEAR,1994) OR EXCLUDE (PUBYEAR,1993) OR EXCLUDE (PUBYEAR,1992) OR EXCLUDE (PUBYEAR,1991) OR EXCLUDE (PUBYEAR,1990) OR EXCLUDE (PUBYEAR,1989) OR EXCLUDE (PUBYEAR,1988) OR EXCLUDE (PUBYEAR,1987) OR EXCLUDE (PUBYEAR,1986) OR EXCLUDE (PUBYEAR,1985) OR EXCLUDE (PUBYEAR,1984) OR EXCLUDE (PUBYEAR,1983) OR EXCLUDE (PUBYEAR,1982) OR EXCLUDE (PUBYEAR,1981) OR EXCLUDE (PUBYEAR,1980) OR EXCLUDE (PUBYEAR,1979) OR EXCLUDE (PUBYEAR,1978) OR EXCLUDE (PUBYEAR,1977) OR EXCLUDE (PUBYEAR,1976) OR EXCLUDE (PUBYEAR,1975) OR EXCLUDE (PUBYEAR,1974) OR EXCLUDE (PUBYEAR,1973) OR EXCLUDE (PUBYEAR,1972) OR EXCLUDE (PUBYEAR,1970) OR EXCLUDE (PUBYEAR,1969))
Methods of Analysis
The statistical tool conferred for analysis is, an evaluating and quantifying tool used to acknowledge number & growth drift of a particular subject or a set of methodologies used to analyse or measure texts and information, referred as bibliometric (Bahuguna et al., 2023; Ellegaard, 2018; Hung, 2012; Liu et al., 2022). Bibliometric is a science in which quantitative approaches are used in various disciplines and are based on numerous features of written articles, such as subject, author, citations, title and so on (Hussain et al., 2011; Kannan & Thanuskodi, 2019). The use of statistical or mathematical methods aids in reaching the objective related to the literature in the specified area. The keywords are significantly focused to establish a concrete definition related to IWB, many keywords with small variations are used for the same purpose. Through quantitative examination of the change regulation of literature information and quantity structure, the research progress of a given field may be assessed and evaluated in a systematic manner (Mao et al., 2018). The selection of the literature for bibliometric studies is an important factor to assure validity and consistency (Lamboglia et al., 2020). Performance analysis (research and publication performance) and science mapping (structures and dynamics) are two of the most common applications of bibliometric approaches (Cobo et al., 2011; Zupic & ater, 2015). There exists many software to conduct the bibliometric analysis ‘Bibexcel, CiteSpace, CitNetExplorer, VOSviewer’ (Moral-Muñoz et al., 2020). VOSviewer is a tool for constructing and visualising bibliometric networks, developed by Nees Jan van Eck and Ludo Waltman. The rationale of selecting VOSviewer and Bibliometrix package over competing software can be traced in its special advantages. Since it is extremely effective at doing co-authorship and bibliographic coupling analyses, crucial for our study. Its ability to handle large datasets effectively produces dynamic visualizations providing unparalleled analytical insights. Furthermore, the credibility of VOS Viewer in academic circles supports the validity and methodological soundness of the present research. The present research employees VOS viewer software version 1.6.19 and Bibliometrix package, R v.4.3.1 to conduct the study.
h Series Index and Impact Factor
The year 2005 brought the term h-index (Hirsch, 2005), which instantly gravitated informetric community. The prime focus towards creation of h-index is to acknowledge the achievement of scientist in various field. In other words, the h-index is used to quantify the work contributed by the scientists in their respective fields (Guns & Rousseau, 2009; Kamrani et al., 2021). With the commenced idea of taking various co-authors into consideration. h-index can be calculated on the basis of citations and publications produced. The h-index is used to test the productivity junction with other bibliometric measures (Batista et al., 2006; Bertran et al., 2020; Van Raan, 2006):
h-index is always  total numbers of papers published
In 1955, Eugene Garfield, for the very first time, inscribed about impact factor (IF) in a magazine known as ‘Science Magazine’ (Garfield, 1955). Not only do average IFs vary over time, but they also vary by field (Althouse et al., 2009). The IF of a journal is used as a proxy for the quality and projected impact of all papers published in that journal. The quasi-qualitative nature of IF and its high accessibility, since it is immediately offered by ISI (Institute for Scientific Information) for the most global and prominent journals, which are some of the reasons for its success (Bordons et al., 2002). IF as a bibliometric indicator employs the cautious usage as the final IF is decided after considering many other variables (Scully & Lodge, 2005). Before calculating an IF all the complexities must be understood as a slight error could paint a completely wrong picture (Seglen, 1997).
The 2022 impact factor of a journal would be calculated as follows:
2022 impact factor = A/B.
where A = the number of times that all items published in that journal in 2020 and 2021 were cited by indexed publications during 2022.
B = the total number of ‘citable items’ published by that journal in 2020 and 2021. (‘Citable items’ for this calculation are usually articles, reviews, proceedings, or notes; not editorials or letters to the editor).
Source: uic.edu
Visualizations
The visualization for the study is constructed with the help of VOSviewer version 1.6.19 and Bibliometrix package for R v.4.3.1. Simply put, visualizations assists in a better analysis and understanding of bibliometric results (Jiang et al., 2019; Wheeldon & Ahlberg, 2011). The research constituents (collaborations, co-authorship and keywords) can also be better examined through visualization (Muhammad et al., 2022). VOSviewer provides an option for three different types of visualizations, that is, the network visualization, the overlay visualization and the density visualization. The present study selects the network visualization for all the visualizations.
Results
Analysis of Characteristics of Documents
Table 1 and Table 2 concur the first objective. To arrive at preliminary results produced from different types of documents and to track the number of documents produced. We simply sift and analyse the data. In total, 12 types of documents were available. Table 1 displays the 12 types of documents, that is, 7,685 reports in the area of IWB. The number of articles totalled to 4,881, which accounts for 63.51% and opted frequently. Documents like, editorial (0.32%), note (0.26%), letter (0.012%), etc., were comparatively less significant.
The selection criteria of IWB displayed the result, which summed to 7,685 documents. Table 2 displays the total contribution from 2001–2022. The maximum publication can be viewed in the year 2022 and the minimum in 2001. Every year displays a different number of publications, following an increasing trend. The sources for these publications can be traced to various reputed journals, (see, Sustainability Switzerland, Frontiers in Psychology, SAE Technical Papers, Engineering Structures, etc.).
Analysis of Subjects
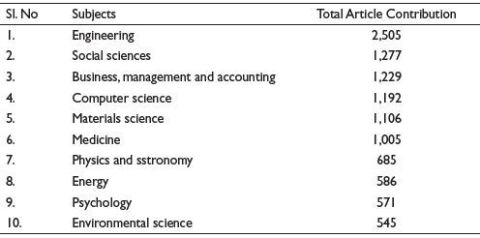
This part achieves the second objective of identifying inter-disciplinary streams in the area of IWB. Table 3 displays the subject-wise analysis of IWB. Ten different subjects cover the term ‘IWB’, where the top three subjects are engineering (32.59%), social sciences (16.61%) and business, and management and accounting (15.9%). The subject with smallest publication in the field of IWB is environmental science (7.09%).
Table 1. Document Type Information During 2001–2022.
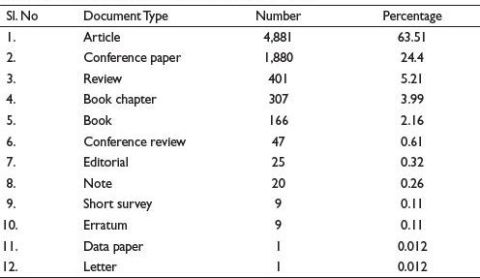
Table 2. Chronological Publication from 2001–2022.
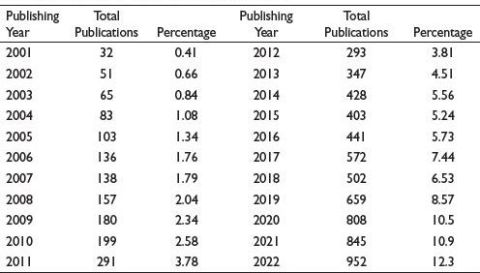
Table 3. Analysis of Subjects.
Source: Scopus.
Analysis of Language, Country, Institutions, Journals and Authors
The third goal, identifying the top contributors in the area of IWB, is achieved in this portion of the study. The area of IWB is published in 23 different languages, where the majority of publications are ranged in the English (97.15%) language. Out of 7,685 documents, 7,466 documents were in English. Table 4 shows the various languages (German, French, Spanish, Russian, Chinese, etc.) in which publications are produced. The rationale behind English being the primary language for publication is that it is the most prevalently used language in research and is widely spoken/understood around the world (Adler & Johnson, 2000; Brambrink et al., 2000; Chiu & Ho, 2005).
Table 4. Language Information of Periodical Articles During 2001–2022.
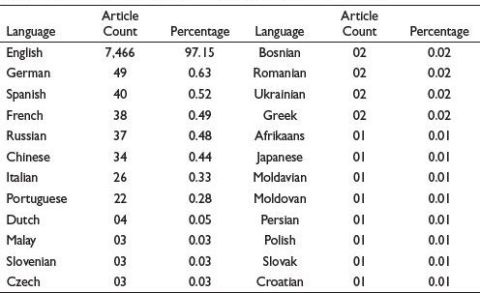
Table 5. Publication from the Top Countries/Regions (2001–2021).
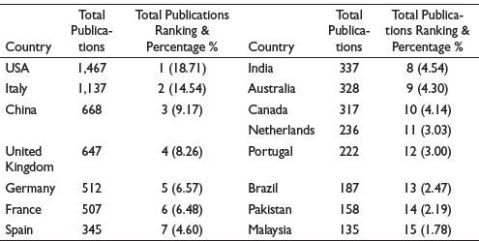
Table 5 represents the contribution done in the field of IWB, geographically. This analysis encloses the diversity in the field of IWB and partially fulfils our third objective of discovering the leading countries in this field. From the global perspective, the leading countries in this field are United States America (1,467), Italy (1,137), China (668), United Kingdom (647) and Germany (512). Western countries contribute significantly in the field of IWB, while Asian countries contributes less.
Figure 1. Country Wise Collaboration of Authors.
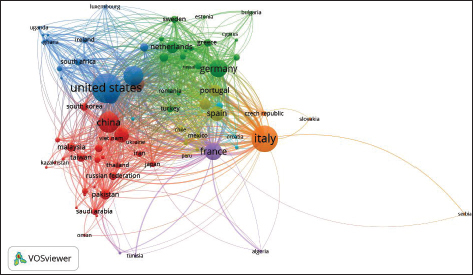
Source: VOSviewer.
Collaborations (among authors/experts) result into new discoveries and insights. Collaboration imparts creativity (Sampaio et al., 2016). Figure 1 showcases the inter-country co-authorship analysis of countries in the field of IWB. The analysis reveals the number of associations of one country’s authors with other country (Khandelwal et al., 2021). The figure has various aspects. Only countries with a minimum of 5 documents and 10 citations were selected. The eight bigger circles in the figure represents the countries (USA, Italy and China), where the majority of collaborations has taken place among the authors in the respective field while the 1,134 links represent collaboration among various countries present in the figure. United States have 1,520 documents in collaborations with a link strength of 723, which is the highest among all, followed by Italy with 1,180 documents and 587 link strength, China with 748 documents and 415 link strength. The figure also conveys the lack of research in developing countries.
The total institutions around the world that publishes in the field of IWB sums up to 11,766. Table 6 enumerates the leading 15 institutions in the relevant field, between 2001 and 2022. The major contribution can be assessed from the European Continent (Italy Politecnico di Milano, Politecnico di Torino, Università degli Studi di Firenze, Paris CNRS Centre National de la Recherche Scientifique). The contribution from the developing country is in a scant position, indicating low density of research.
Figure 2 portrays the bibliographic coupling of the institutions in the field of IWB. Bibliographic coupling explains how two different documents cite a common document (Maseda et al., 2022). This study seeks the bibliographic coupling of the institutions, which means how two different institution references the publication of the same institution. Thus, explaining how a citation provides the information of similarities among documents. An assumption that underlies bibliographic coupling is that the two documents which referenced the third documents are related. The same can be also viewed in the cluster. The minimum threshold for the documents were kept to 5. The visualization provides three clusters with 33 links and total link strength of 189. The top three institution that majors in coupling and cluster is the Department of management sciences (Hazara University, Pakistan) followed by School of Economics and Management (Tongii University, China) and Department of Economics (University of Insubria, Italy).
Table 6. Most Productive Institutions.
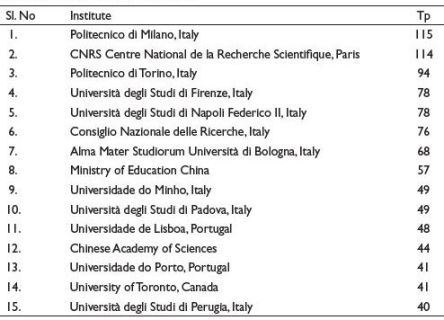
Source: Scopus.
Figure 2. Bibliographic Coupling of Institution.
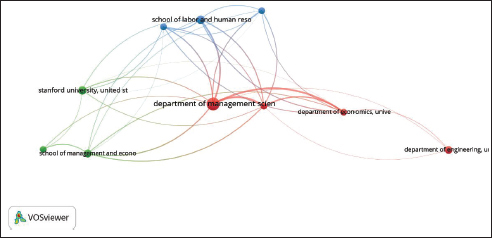
Source: VOSviewer.
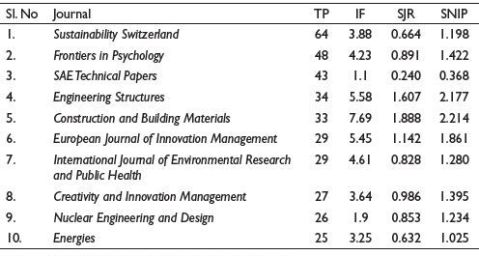
Table 7. Most Influential Journals.
Source: Compiled from Scopus and Websites, respectively.
Note: The authors have only taken 10 journals in consideration and has excluded conference proceeding, book, book series and trade journal. The impact factor was collected from the official websites of the journal as on May 25th 2023.
The publications made in the field of IWB is published in more than 100 journals. The first 10 journals with their total papers, impact factor, SJR and SNIP are enlisted in Table 7. The IF identifies the significance of a journal. SJR creates a distinction amid a journal’s popularity and prestige, and the ratio of degree of topicality and citation impact of a journal (Colledge et al., 2010). The journals quantity up to 4.65% of the total publications. The top three journals with most articles are Sustainability Switzerland, Frontiers in Psychology and SAE Technical Papers. Another way to look at this table is from the IF column. The IF of all the journals is displayed which indicates the citing frequency of a publication from a particular journal. IF also helps in the ranking of the journals. Thus, on the basis of IF, the top three journals are Construction and Building Materials, Engineering Structures and European Journal of Innovation Management.
Figure 3 shows the citation analysis of different journals in the field of IWB. Out of 4,407 journals, more than 150 journals were cited more than 50 times. Creativity and Innovation Management was cited more than 2,000 times followed by the Journal of Occupational and Organization Psychology with 1,880 citations and Fuel with 1,399 citations.
Figure 3. Citation Analysis of Journals.
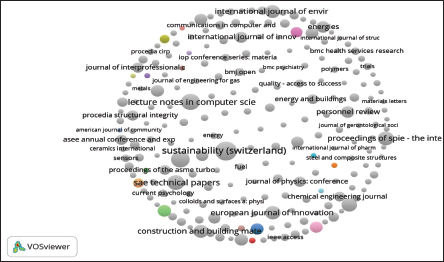
Sources: VOSviewer.
As can be acknowledged from Table 8, top 10 authors were affiliated to four countries namely Pakistan, Italy, France and Germany. The majority of the authors belong to European continent. The articles published by these authors ranges from the year 2001 to 2022. Afsar, Bilal is the top ranked author among all, affiliated from Pakistan with a contribution of 24 articles and the highest h-index among all of 29, followed by Meli, Enrico affiliated from Università degli Studi di Firenze, Italy with an article contribution of 22 publication and h-index of 27.
Table 8. Analysis of Authors.
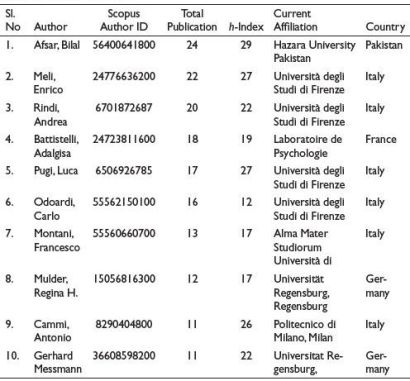
Source: Scopus.
Figure 4. Co-Citation Visualization.
Source: VOSviewer.
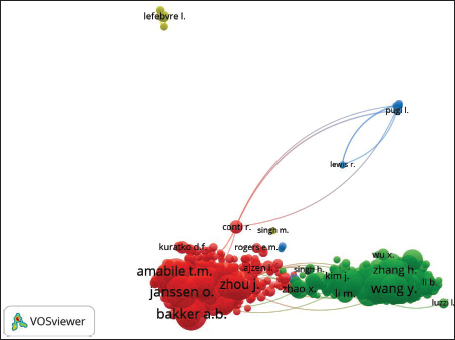
Co-citation analysis aids the understanding for cognitive structure (Surwase et al., 2011). In author’s co-citation analysis frequently cited authors can be traced, the unit of analysis is co-cited and frequently cited authors (Osareh, 1996). Figure 4 represents the co-citation visualization of authors in the field of IWB. The number of citation of an author plays a very significant role. There are 4 clusters, where the cluster in red represents the authors with highest citations (Janssen 1,249 citations, Bakker 1,185 citations). The authors in red (539 authors) and green (448 authors) clusters are the authors who have more than 500 citations.
Analysis of Keywords
This section accomplishes the last objective of the study. Keywords describe the authors’ perceptions of the most essential terms in their publications (Pesta et al., 2018). Table 9 aims to identify the most common keywords used to discover the articles in the field of IWB. To analyse the keyword below ‘author’s keywords’ were taken to consideration. In the presence of 7,685 articles a total number of 6,527 keyword appeared. Only 697 keywords appeared more than 20 times. Only 697 keywords were found to have a frequency of more than 20 occurrences, with ‘innovative work behavior’ (326), ‘innovation’ (251), and ‘innovative work behaviour’ (204) ranking as the top three most frequently used/appeared keywords.
Table 9. Analysis of Keywords.
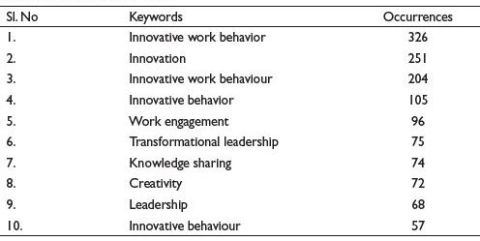
Source: VOSviewer.
Figure 5. Analysis of Keywords.
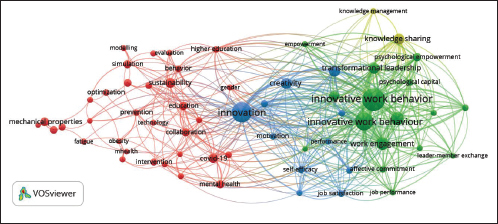
Source: VOSviewer.
The co-occurrence of keywords is based on the concept of ‘presence’, ‘occurring frequency’ or ‘similar keywords’. There exist three methods to search keywords, on the basis of all keywords, author keywords and indexed keyword (Su & Lee, 2010). Figure 5 shows the link strength of 1,120 among 62 items in the four clusters. The distance among the nodes describes the relation, which means the shorter the node, the stronger the relationship and vice versa. The keywords also categories the nomenclature according to the region/territory (e.g., behavior and behaviour).
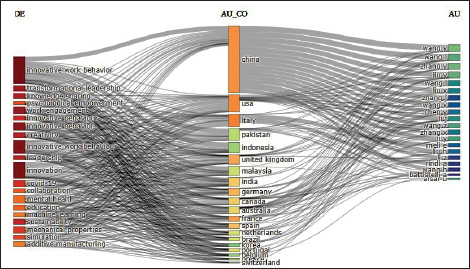
Figure 6. A Three-Field Plot Showing the Network Between Keywords (Left), Countries (Middle) and Authors (Right) for Innovative Work Behaviour.
Source: Bibliometrix.
This part of the study presents the bird-eye view of the publication pattern of IWB. The three-field plot (Sankey Diagram) analysis sheds light on the intricate interaction between keywords, countries and authors of the maximum cited references for the 20 most researched terms in the domain of IWB. The height of the nodes (countries) is proportional to the frequency of using a certain keyword within the field. Figure 6 describes that keywords, such as innovative work behaviour, transformational leadership, knowledge sharing, psychological empowerment, work engagement, innovative behaviour, creativity, as the main centre of interest in this field for the countries like China, U.S.A. and Italy.
Conclusion
The study presents the bibliometric analysis on innovative work behavior during 2001–2022. The database selected for the study was Scopus. A total of 8,382 documents appeared for the search term out of which 7,685 documents were selected for the study. The study is aligned with the objectives. The first section of the study deals with the elaboration about the methodology selected for the study, that is, VOSviewer version 1.6.19 and Bibliometric Analysis. The second part discloses the various results of innovative work behavior. Analysis of documents is the first section of result, where the number of documents produced per year is presented with different types of documents (articles, notes etc.). Followed by the analysis of subjects were the subjects involved in the field of innovative work behavior was explored (engineering, social sciences, etc.). Analysis of language, country, institutions, journals and authors are identified next. As an add-on, the study also presents different visualizations such as, inter-country co-authorship analysis, bibliographic coupling, citation analysis and keywords analysis of the relevant area. This information is significant in exploring the field of innovative work behavior. The institution with the most publications is Politecnico di Milano in Italy, and it can be inferred from this that the majority of institutions active in the field of IWB are also found in the European continent. In the inter-country co-authorship United States of America, Italy and China are the significant countries with majority collaborations with other countries. The author with the most output is Bilal Afsar from Hazara University in Pakistan, and Sustainability Switzerland is the journal with the most publications and has been cited more than 200 times. Keywords like ‘innovative work behavior’, ‘innovation’, ‘innovative work behaviour’ appeared for more than 200 times in the searched articles. These keywords also serve as the hot-spots for further studies. The publication trends and inter-disciplinary tables (Tables 2 and 3) displays the rising trend, denoting the increasing interest of researchers in the field. Global interest in this area can also be traced by institution- and country-specific research on IWB. This study also advocates for ‘Geographical Diversity’ since the institutions, journals and countries are from different parts of the globe. This variation implies a different viewpoint on innovative work behavior from different parts of the world. The visual depiction to illustrate the interrelationships among keywords, countries and authors through Sankey diagram within the framework of extensively cited references within the IWB domain. The visualization underscores pivotal keywords that hold centrality in the field. Notably, certain countries, including China, the United States and Italy, emerge as noticeable contributors to research pertaining to these focal keywords.
Implications, Limitations and Direction for Future Research
A thorough study on bibliometric analysis imbibes various implications. However, the certainty of implications of bibliometric analysis will always vary with the scope. Some of the implications built on the basis of the present study are as follows:
The study offers various advantages but some limitations are always present. The limitations can be interpreted as the passage for future research. The period of study was from 2001 to 2022. Future researchers could increase the time period for more comprehensive outcomes. In the bibliometric analysis all factors, such as journal, authors, subjects, type of documents, institutions and countries, were analysed except funding/sponsor, future researchers can also take this significant factor in account. The database opted for the study was Scopus, other database like web of science, dimensions and google scholar were not taken into consideration, this can be used as an opportunity by future researchers to choose other database for the study.
A vast area of study has been uncovered in the field of innovative work behavior in previous studies (e.g., innovative work behavior and work engagement, knowledge sharing, organizational culture, leadership, employee skills and aptitudes) (Middleton & Hall, 2021). The major studies can also be witnessed from the developed nation and not from the developing economies. IWB has been confined to a very few subjects; hence, this narrows exploration. Thus, future researcher can shift their focus to gauge the innovative work behavior in the situations of emerging nations and subjects, respectively.
Declaration of Conflicting Interests
The authors declared no potential conflicts of interest with respect to the research, authorship and/or publication of this article.
Funding
The authors received no financial support for the research, authorship and/or publication of this article.
ORCID iD
Sudhir Chandra Das https://orcid.org/0000-0003-3511-8693
Adler, M. D., & Johnson, K. B. (2000). Quantifying the literature of computer-aided instruction in medical education. Academic Medicine, 75(10), 1025–1028.
Althouse, B. M., West, J. D., Bergstrom, C. T., & Bergstrom, T. (2009). Differences in impact factor across fields and over time. Journal of the American Society for Information Science and Technology, 60(1), 27–34. http://doi.org/10.1002/asi.20936
Amabile, T. M., Conti, R., Coon, H., Lazenby, J., & Herron, M. (1996). Assessing the work environment for creativity. Academy of Management Journal, 39(5), 1154–1184.
Amabile, T. M., & Pratt, M. G. (2016). The dynamic componential model of creativity and innovation in organizations: Making progress, making meaning. Research in Organizational Behavior, 36, 157–183. http://doi.org/10.1016/j.riob.2016.10.001
Anderson, N., & King, N. (1991). Managing innovation in organisations. Leadership & Organization Development Journal, 12(4), 17–21.
Ausat, A. M. A., Widayani, A., Rachmawati, I., Latifah, N., & Suherlan, S. (2022). The effect of intellectual capital and innovative work behavior on business performance. Journal of Economics, Business, & Accountancy Ventura, 24(3), 363–378.
Backhaus, K., Lügger, K., & Koch, M. (2011). The structure and evolution of business-to-business marketing: A citation and co-citation analysis. Industrial Marketing Management, 40(6), 940–951. https://doi.org/10.1016/j.indmarman.2011.06.024
Baer, M., Oldham, G. R., & Cummings, A. (2003). Rewarding creativity: When does it really matter? The Leadership Quarterly, 14(4–5), 569–586. https://doi.org/10.1016/S1048-9843(03)00052-3
Bahuguna, P. C., Srivastava, R., & Tiwari, S. (2023). Two-decade journey of green human resource management research: A bibliometric analysis. Benchmarking: An International Journal, 30(2), 585–602.
Batista, P. D., Campiteli, M. G., & Kinouchi, O. (2006). Is it possible to compare researchers with different scientific interests? Scientometrics, 68(1), 179–189. https://doi.org/10.1007/s11192-006-0090-4
Berg, J. M. (2016). Balancing on the creative highwire: Forecasting the success of novel ideas in organizations. Administrative Science Quarterly, 61(3), 433–468. https://doi.org/10.1177/0001839216642211
Bertran, K., Cortey, M., & Díaz, I. (2020). The use of h-index to assess research priorities in poultry diseases. Poultry Science, 99(12), 6503–6512.
Bordons, M., Fernández, M., & Gómez, I. (2002). Advantages and limitations in the use of impact factor measures for the assessment of research performance. Scientometrics, 53(2), 195–206 https://doi.org/10.1023/a:1014800407876
Bos-Nehles, A., Renkema, M., & Janssen, M. (2017). HRM and innovative work behaviour: A systematic literature review. Personnel Review, 46(7), 1228–1253.
Botelho, C. (2020). The influence of organizational culture and HRM on building innovative capability. International Journal of Productivity and Performance Management, 69(7), 1373–1393.
Brambrink, A. M., Ehrler, D., & Dick, W. F. (2000). Publications on paediatric anaesthesia: A quantitative analysis of publication activity and international recognition. British Journal of Anaesthesia, 85(4), 556–562.
Chen, J., Tang, G., Yao, J., & Zhou, G. (2023). Employee sentiment and stock returns. Journal of Economic Dynamics and Control, 149, 104636. https://doi.org/10.1016/j.jedc.2023.104636
Chen, X., Xie, H., Wang, F. L., Liu, Z., Xu, J., & Hao, T. (2018). A bibliometric analysis of natural language processing in medical research. BMC Medical Informatics and Decision Making, 18(1), 1–14. https://doi.org/10.1186/s12911-018-0594-x
Chiu, W. T., & Ho, Y.S. (2005). Bibliometric analysis of homeopathy research during the period of 1991 to 2003. Scientometrics, 63(1), 3–23.
Cobo, M. J., López-Herrera, A. G., Herrera-Viedma, E., & Herrera, F. (2011). Science mapping software tools: Review, analysis, and cooperative study among tools. Journal of the American Society for Information Science and Technology, 62(7), 1382–1402. https://doi.org/10.1002/asi.21525
Colledge, L., de Moya-Anegón, F., Guerrero-Bote, V. P., López-Illescas, C., & Moed, H. F. (2010). SJR and SNIP: Two new journal metrics in Elsevier’s Scopus. Insights, 23(3), 215–221.
Culnan, M. J. (1986). The intellectual development of management information systems, 1972–1982: A co-citation analysis. Management Science, 32(2), 156–172. https://doi.org/10.1287/mnsc.32.2.156
Deb, N. (2021). A knowledge-based view of people and technology: Directions for a value co-creation-based learning organisation. Webology, 18(5) 364–371.
De Jong, J., & Den Hartog, D. (2010). Measuring innovative work behaviour. Creativity and Innovation Management, 19(1), 23–36. https://doi.org/10.1111/j.1467-8691.2010.00547.x
Del Giudice, M., Khan, Z., De Silva, M., Scuotto, V., Caputo, F., & Carayannis, E. (2017). The microlevel actions undertaken by owner-managers in improving the sustainability practices of cultural and creative small and medium enterprises: A United Kingdom–Italy comparison. Journal of Organizational Behavior, 38(9), 1396–1414.
Donthu, N., Kumar, S., & Pattnaik, D. (2020). Forty-five years of journal of business research: A bibliometric analysis. Journal of Business Research, 109, 1–14. https://doi.org/10.1016/j.jbusres.2019.10.039
Durisin, B., & Puzone, F. (2009). Maturation of corporate governance research, 1993–2007: An assessment. Corporate Governance: An International Review, 17(3), 266–291. https://doi.org/10.1111/j.1467-8683.2009.00739.x
El-Kassar, A.-N., Dagher, G. K., Lythreatis, S., & Azakir, M. (2022). Antecedents and consequences of knowledge hiding: The roles of HR practices, organizational support for creativity, creativity, innovative work behavior, and task performance. Journal of Business Research, 140, 1–10. https://doi.org/10.1016/j.jbusres.2021.11.079
Ellegaard, O. (2018). The application of bibliometric analysis: Disciplinary and user aspects. Scientometrics, 116(1), 181–202.
Ellegaard, O., & Wallin, J. A. (2015). The bibliometric analysis of scholarly production: How great is the impact? Scientometrics, 105(3), 1809–1831. https://doi.org/10.1007/s11192-015-1645-z
Garfield, E. (1955). Citation indexes for science: A new dimension in documentation through association of ideas. Science, 122(3159), 108–111. https://doi.org/10.1126/science.122.3159.108
Groza, M. D., Locander, D. A., & Howlett, C. H. (2016). Linking thinking styles to sales performance: The importance of creativity and subjective knowledge. Journal of Business Research, 69(10), 4185–4193. http://doi.org/10.1016/j.jbusres.2016.03.006
Guns, R., & Rousseau, R. (2009). Simulating growth of the h-index. Journal of the American Society for Information Science and Technology, 60(2), 410–417. https://doi.org/10.1002/asi.20973
Hassan, S., Ghias, W., Saeed, S., Shaukat, M. O., & Abro, S. (2021). Research domain of innovative work behaviour: A bibliometric analysis of fifteen years research
(2005-2020). Elementary Education Online, 20(1), 3900–3927.
Heberger, A. E., Christie, C. A., & Alkin, M. C. (2010). A bibliometric analysis of the academic influences of and on evaluation theorists’ published works. American Journal of Evaluation, 31(1), 24–44. https://doi.org/10.1177/1098214009354120
Hirsch, J. E. (2005). An index to quantify an individual’s scientific research output. Proceedings of the National academy of Sciences, 102(46), 16569–16572. https://doi.org/10.1073/pnas.0507655102
Høyrup, S. (2010). Employee-driven innovation and workplace learning: Basic concepts, approaches and themes. Transfer: European Review of Labour and Research, 16(2), 143–154.
Hu, J. E., Khayrallah, H., Culkin, R., Xia, P., Chen, T., Post, M., & Van Durme, B. (2019, June). Improved lexically constrained decoding for translation and monolingual rewriting [Paper presented]. Proceedings of the 2019 Conference of the North American Chapter of the Association for Computational Linguistics: Human Language Technologies, Volume 1 (Long and Short Papers) (pp. 839–850). https://doi.org/10.18653/v1/N19-1090
Huang, X., Wang, L., & Liu, W. (2023). Identification of national research output using Scopus/Web of Science Core Collection: A revisit and further investigation. Scientometrics, 128(4), 2337–2347.
Hung, J. L. (2012). Trends of e-learning research from 2000 to 2008: Use of text mining and bibliometrics. British Journal of Educational Technology, 43(1), 5–16.
Hussain, A., Fatima, N., & Kumar, D. (2011). Bibliometric analysis of the Electronic Library journal. Webology, 8(1), 87. http://www.webology.org/2011/v8n1/a87.html
Janssen, O. (2000). Job demands, perceptions of effort-reward fairness and innovative work behaviour. Journal of Occupational and Organizational Psychology, 73(3), 287–302. https://doi.org/10.1348/096317900167038
Janssen, O. (2001). Fairness perceptions as a moderator in the curvilinear relationships between job demands, and job performance and job satisfaction. Academy of Management Journal, 44(5), 1039–1050.
Jiang, Y., Ritchie, B. W., & Benckendorff, P. (2019). Bibliometric visualisation: An application in tourism crisis and disaster management research. Current Issues in Tourism, 22(16), 1925–1957.
Jiménez-García, M., Ruiz-Chico, J., Peña-Sánchez, A. R., & López-Sánchez, J. A. (2020). A bibliometric analysis of sports tourism and sustainability (2002–2019). Sustainability, 12(7), 2840. https://doi.org/10.3390/su12072840
Kamrani, P., Dorsch, I., & Stock, W. G. (2021). Do researchers know what the h-index is? And how do they estimate its importance? Scientometrics, 126(7), 5489–5508.
Kannan, P., & Thanuskodi, S. (2019). Bibliometric analysis of library philosophy and practice: A study based on Scopus Database. Library Philosophy and Practice, 1–13. https://core.ac.uk/download/pdf/220153198.pdf
Khandelwal, U., Tripathi, V., & Gupta, A. (2021). A bibliometric analysis of green branding research from 2000 to 2019. Vision. Advance online publication. https://doi.org/10.1177/09722629211033916
Kleysen, R. F., & Street, C. T. (2001). Toward a multi-dimensional measure of individual innovative behavior. Journal of Intellectual Capita, 2(3), 284–296. https://doi.org/10.1108/EUM0000000005660
Koednok, S., & Sungsanit, M. (2018). The influence of multilevel factors of human resource practices on innovative work behavior. The Journal of Behavioral Science, 13(1), 37–55. https://doi.org/10.13140/RG.2.2.31220.45441
Kraus, S., Li, H., Kang, Q., Westhead, P., & Tiberius, V. (2020). The sharing economy: A bibliometric analysis of the state-of-the-art. International Journal of Entrepreneurial Behavior & Research, 26(8), 1769–1786. https://doi.org/10.1108/IJEBR-06-2020-0438
Kumar, S., Lim, W. M., Pandey, N., & Christopher Westland, J. (2021a). 20 years of electronic commerce research. Electronic Commerce Research, 21(1), 1–40. https://doi.org/10.1007/s10660-021-09464-1
Kumar, S., Sureka, R., Lim, W. M., Kumar Mangla, S., & Goyal, N. (2021b). What do we know about business strategy and environmental research? Insights from Business Strategy and the Environment. Business Strategy and the Environment, 30(8), 3454–3469. https://doi.org/10.1002/bse.2813
Kumpulainen, M., & Seppänen, M. (2022). Combining Web of Science and Scopus datasets in citation-based literature study. Scientometrics, 127(10), 5613–5631.
Lamboglia, R., Lavorato, D., Scornavacca, E., & Za, S. (2020). Exploring the relationship between audit and technology. A bibliometric analysis. Meditari Accountancy Research, 29(5), 1233–1260. https://doi.org/10.1108/MEDAR-03-2020-0836
Linnenluecke, M. K., Chen, X., Ling, X., Smith, T., & Zhu, Y. (2017). Research in finance: A review of influential publications and a research agenda. Pacific-Basin Finance Journal, 43, 188–199. https://doi.org/10.1016/j.pacfin.2017.04.005
Linsey, J. S., Green, M. G., Murphy, J. T., Wood, K. L., & Markman, A. B. (2005, January). ‘Collaborating to success’: An experimental study of group idea generation techniques [Paper presented]. International Design Engineering Technical Conferences and Computers and Information in Engineering Conference 4742, 277–290. https://doi.org/10.1115/DETC2005-85351
Liu, L. L., Zhang, J., Li, J. Z., Huang, F., & Wang, L. C. (2022). A bibliometric analysis of the landslide susceptibility research (1999–2021). Geocarto International, 37(26), 14309–14334.
Mao, G., Huang, N., Chen, L., & Wang, H. (2018). Research on biomass energy and environment from the past to the future: A bibliometric analysis. Science of the Total Environment, 635, 1081–1090. https://doi.org/10.1016/j.scitotenv.2018.04.173
Maseda, A., Iturralde, T., Cooper, S., & Aparicio, G. (2022). Mapping women’s involvement in family firms: A review based on bibliographic coupling analysis. International Journal of Management Reviews, 24(2), 279–305.
Middleton, L., & Hall, H. (2021). Workplace information literacy: A bridge to the development of innovative work behaviour. Journal of Documentation, 77(6), 1343–1363. https://doi.org/10.1108/JD-03-2021-0065
Montero-Díaz, J., Cobo, M. J., Gutiérrez-Salcedo, M., Segado-Boj, F., & Herrera-Viedma, E. (2018). A science mapping analysis of ‘Communication’ WoS subject category (1980-2013). Comunicar. Media Education Research Journal, 26(1). https://doi.org/10.3916/C55-2018-08
Moral-Muñoz, J. A., Herrera-Viedma, E., Santisteban-Espejo, A., & Cobo, M. J. (2020). Software tools for conducting bibliometric analysis in science: An up-to-date review. Profesional de la Información, 29(1). https://doi.org/10.3145/epi.2020.ene.03
Muhammad, M., Zawawi, M. A. M., Jusoh, M. F., Naher, L., Latif, N. S. A., & Hasli, M. A. (2022, November). A decade of literature on climate in phytopathological research: Visualising and bibliometrics analysis. IOP Conference Series: Earth and Environmental Science (Vol. 1102, pp. 1–8). https://doi.org/10.1088/1755-1315/1102/1/012006
Mustafa, M., Coetzer, A., Ramos, H. M., & Fuhrer, J. (2021). Exploring the effects of small-and medium-sized enterprise employees’ job satisfaction on their innovative work behaviours: The moderating effects of personality. Journal of Organizational Effectiveness: People and Performance, 8(2), 228–250.
Nederhof, A. J. (2006). Bibliometric monitoring of research performance in the social sciences and the humanities: A review. Scientometrics, 66(1), 81–100. https://doi.org/10.1007/s11192-006-0007-2
Nguyen, N. T., Hooi, L. W., & Avvari, M. V. (2023). Leadership styles and organisational innovation in Vietnam: Does employee creativity matter? International Journal of Productivity and Performance Management, 72(2), 331–360.
Osareh, F. (1996). Bibliometrics, citation analysis and co-citation analysis: A review of literature I. Libri, 46, 149–158. https://www.degruyter.com/document/doi/10.1515/libr.1996.46.3.149/html
Peerzadah, S. A., Mufti, S., & Majeed, S. (2023). Mapping the scientific evolution of innovative work behavior: A bibliometric analysis of three decades. International Journal of Innovation Science. Advance online publication. https://doi.org/10.1108/IJIS-08-2022-0154
Peng, R., Chen, J., & Wu, W. (2021). Mapping innovation research in organizations: A bibliometric analysis. Frontiers in Psychology, 12, 750960. https://doi.org/10.3389/fpsyg.2021.750960
Perry-Smith, J. E. (2006). Social yet creative: The role of social relationships in facilitating individual creativity. Academy of Management Journal, 49(1), 85–101. https://doi.org/10.5465/amj.2006.20785503
Pesta, B., Fuerst, J., & Kirkegaard, E. O. (2018). Bibliometric keyword analysis across seventeen years (2000–2016) of intelligence articles. Journal of Intelligence, 6(4), 46. https://doi.org/10.3390/jintelligence6040046
Pritchard, A. (1969). Statistical bibliography or bibliometrics. Journal of Documentation, 25(4), 348–349. https://cir.nii.ac.jp/crid/1570009750342049664
Purwanto, A. (2022). Tourist satisfaction and performance of tourism industries: How the role of innovative work behaviour, organizational citizenship behaviour? Journal of Industrial Engineering & Management Research, 3(1), 1–11.
Radaelli, G., Lettieri, E., Mura, M., & Spiller, N. (2014). Knowledge sharing and innovative work behaviour in healthcare: A micro-level investigation of direct and indirect effects. Creativity and Innovation Management, 23(4), 400–414. https://doi.org/10.1111/caim.12084
Ramamoorthy, N., Flood, P. C., Slattery, T., & Sardessai, R. (2005). Determinants of innovative work behaviour: Development and test of an integrated model. Creativity and Innovation Management, 14(2), 142–150. https://doi.org/10.1111/j.1467-8691.2005.00334.x
Rietzschel, E. F., & Ritter, S.M. (2018). Moving from creativity to innovation. In Individual creativity in the workplace (pp. 3–34). Academic Press. https://doi.org/10.1016/B978-0-12-813238-8.00001-2
Salam, S., & Senin, A. A. (2022). A bibliometric study on innovative behavior literature (1961–2019). Sage Open, 12(3). https://doi.org/10.1177/21582440221109589
Samiee, S., & Chabowski, B. R. (2012). Knowledge structure in international marketing: A multi-method bibliometric analysis. Journal of the Academy of Marketing Science, 40(2), 364–386. https://doi.org/10.1007/s11747-011-0296-8
Sampaio, R. B., Fonseca, M.V.D.A., & Zicker, F. (2016). Co-authorship network analysis in health research: Method and potential use. Health Research Policy and Systems, 14(1), 1–10.
Scott, S.G., & Bruce, R. A. (1994). Determinants of innovative behavior: A path model of individual innovation in the workplace. Academy of Management Journal, 37(3), 580–607.
Scully, C., & Lodge, H. (2005). Impact factors and their significance; Overrated or misused? British Dental Journal, 198(7), 391–393. https://doi.org/10.1038/sj.bdj.4812185
Seglen, P.O. (1997). Why the impact factor of journals should not be used for evaluating research. BMJ, 314(7079), 497. https://doi.org/10.1136/bmj.314.7079.497
Shi, Y., Blainey, S., Sun, C., & Jing, P. (2020). A literature review on accessibility using bibliometric analysis techniques. Journal of Transport Geography, 87, 102810 https://doi.org/10.1016/j.jtrangeo.2020.102810
Su, H. N., & Lee, P. C. (2010). Mapping knowledge structure by keyword co-occurrence: A first look at journal papers in Technology Foresight. Scientometrics, 85(1), 65–79.
Surwase, G., Sagar, A., Kademani, B. S., & Bhanumurthy, K. (2011). Co-citation analysis: An overview [Paper presented]. Beyond Librarianship: Creativity, Innovation and Discovery, Mumbai, India, pp. 179–185.
Szczepa?ska-Woszczyna, K., & Dacko-Pikiewicz, Z. (2014). Managerial competencies and innovations in the company–the case of enterprises in Poland. Business, Management and Economics Engineering, 12(2), 266–282. https://doi.org/10.3846/bme.2014.240
Valaei, N., Rezaei, S., & Ismail, W.K.W. (2017). Examining learning strategies, creativity, and innovation at SMEs using fuzzy set Qualitative Comparative Analysis and PLS path modeling. Journal of Business Research, 70, 224–233. https://doi.org/10.1016/j.jbusres.2016.08.016
Van Raan, A. F. (2006). Comparison of the Hirsch-index with standard bibliometric indicators and with peer judgment for 147 chemistry research groups. Scientometrics, 67(3), 491–502. http://doi.org/10.1556/Scient.67.2006.3.10
Waheed, A., Waheed, S., Ahmad, N., & Karamat, J. (2023). Work engagement and organisation performance: The mediating role of innovative work behaviour and moderating role of perceived distributive fairness in manufacturing industry of Pakistan. International Journal of Business Performance Management, 24(1), 47–72.
Wheeldon, J., & Ahlberg, M. K. (2011). Visualizing social science research: Maps, methods, & meaning. Sage.
Xu, X., Chen, X., Jia, F., Brown, S., Gong, Y., & Xu, Y. (2018). Supply chain finance: A systematic literature review and bibliometric analysis. International Journal of Production Economics, 204, 160–173. https://doi.org/10.1016/j.ijpe.2018.08.003
Yilmaz, S., Daly, S. R., Seifert, C. M., & Gonzalez, R. (2016). Evidence-based design heuristics for idea generation. Design Studies, 46, 95–124. https://doi.org/10.1016/j.destud.2016.05.001
Zhang, X. (2020). A bibliometric analysis of second language acquisition between 1997 and 2018. Studies in Second Language Acquisition, 42(1), 199–222. https://doi.org/10.1017/S0272263119000573
Zupic, I., & ?ater, T. (2015). Bibliometric methods in management and organization. Organizational Research Methods, 18(3), 429–472. https://doi.org/10.1177/1094428114562629
